Nassi-Schneiderman diagrams
After completing this lesson you should be able to:
- describe what is meant by a Nassi-Schneiderman diagram (NS diagram)
- sketch the symbols and constructs used in NS diagrams
- sketch simple program designs using NS diagrams
There is an exercise for you to do with a sample
answer and after you have finished you might like to attempt these questions
to assess how much you have learned.
This is the last lesson in the course.
Return to the index
Return to the previous lesson
What is a Nassi-Schneiderman diagram
The Nassi-Schneiderman (NS) diagram is a graphical method of stating algorithms.
Many people claim that it is very easy to read, especially for beginners.
That is probably true but maintaining NS diagrams can be a problem for
the program designer. Here is a simple example of a NS diagram:

The diagram indicates an algorithm with a process (Process 1) followed by
a decision. Each outcome of the decision has a process associated with
it. If the decision evaluates as true then Proc 2 is carried out, if false
then Proc 3 is carried out. In the table that follows you will see the
symbols that are usd in NS diagrams. As with flow charts the symbols are
few and easily remembered. The different symbols are "fitted" together
like pieces in a jigsaw puzzle.
|
If you go searching for more information on Nassi-Schneiderman you
will find a variety of spellings of the name Schneiderman, for example
Shneiderman and Shneidermann. I just thought I'd tell you that. It is not unusual for
the spelling of names to change over time. For instance I am descended from Bostocks,
Hewitts, Hoares, Roches, SideBothams, Beechs, Proudloves and so on. Over time the spelling
of the names Hoare, Roche and Sidebotham have been variously Hoar, Hore, Roach, Roache, SideBottom and
SideBothom. I just thought I'd tell you that. The Roche or Roach is a European freshwater fish. The
rumour that I am descended from a cockroach is quite unfounded.
The NS symbols and constructs
NS symbols and constructs

|
The process symbol looks much the same as the program flow
chart symbol. You'll see soon though that NS diagrams look quite different
from the flow charts you have used before.
|

|
The decision symbol is quite different. You will see soon how it is used.
|

|
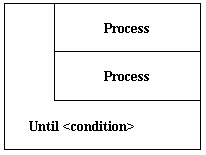
The repeat construct is also quite different and like the while construct
shown below it gives a good indication of the scope of the repeat. The
repeat condition extends up on the left of the processes it controls.
|

|
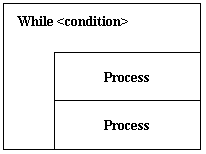
You can see that the while construct is the reverse of the repeat.
The while condition extends down on the left to border the processes it
controls.
|
Designing programs with NS diagrams
Drawing program designs with NS diagrams is quite simple but the NS method
differs from the program flow chart method. Apart from different symbols
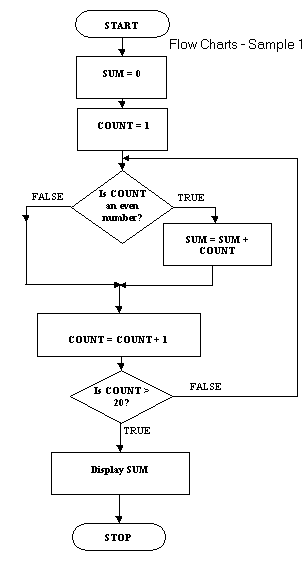
NS does not use connectors between the symbols. A comparison of an NS chart
and a flow chart is shown below:
As with the flow the direction of sequence in the NS chart is from top
to bottom. There are some problems with the NS charts that don't
really occur with flow charts:
- It is not as easy to stress the process one entry-one exit point rule as it is in flow charts.
- The null-else is not really obvious.
- Modification of an NS diagram probably requires more work than the equivalent flow chart.
Exercise 1
Sketch NS diagrams for the following pseudocode fragments:
|
(1)
IF x = = 100
THEN IF x == 120
THEN IF x == 140
THEN DISPLAY 'A'
ELSE DISPLAY 'B'
ELSE DISPLAY 'C'
ELSE DISPLAY 'D'
ENDIF |
(2)
X = 1
REPEAT
X = X + 1
DISPLAY X
UNTIL X > 10 |
(3)
X = 0
Y = 0
DOWHILE X < 10
DISPLAY X
REPEAT
Y = Y + 1
UNTIL Y > 5
X = X + 1
Y = 0
END WHILE
|
There is a sample answer here but
attempt the exercise for yourself before looking at the sample.
Summary
In this lesson you studied Nassi-Schneiderman diagrams, another graphical
method of of designing 3GL programs. This was quite a short lesson and
you should have learned:
- how to draw the symbols and constructs used in NS diagrams
- how to use NS diagrams in simple program designs
The course is finished now and I hope that you found it challenging and
rewarding. Program design is one part of the much bigger discipline of
software engineering and perhaps this course has whetted your appetite
for software engineering.
Return to the index
Return to the previous lesson
This publication is copyright David Beech and Learning Systems 1997-2002
and may not be reproduced by any means without the written permission of
David Beech.
9 Wyndella Street, Tasmania, Australia
db@codelearn.com


