Designing programs with flow charts
After completing this lesson you should be able to:
- describe what is meant by a program flow chart
- sketch the symbols and constructs used in flow charts
- state the guidelines for drawing flow charts
- design programs using flow charts
- use subprocesses in flow charts
- use nested loops in flow charts
- use multiway selection in flow charts
There are some exercises for you to do and each exercise has a sample answer:
Exercise 1 - a first flow chart
Exercise 2 - a flow chart with subprocesses
Exercise 3 - an advanced flow chart exercise
Exercise 4 - comparing flow charts and pseudocode
When you have finished the lesson you might like to attempt these questions
to assess how much you have learned.
Return to the index
Go to the next lesson
Return to the previous lesson
What is a flow chart?
Step-form and pseudocode program designs are both text-based, the statements
are written. Flow charts are a graphical method of designing programs and
once the rules are learned are very easy to draw. A well-drawn flow chart
is also very easy to read since it basically uses just two symbols, two
decision constructs. and two iteration constructs:
- the sequence symbol,
- the decision symbol,
- the decision construct if ... then
- the decision construct if ... then ... else
- the repetition construct - repeat,
- the repetition construct - while,
there are other symbols but the real work is depicted by the two symbols
and the constructs. This shouldn't come as a surprise since in the step-form
and pseudocode that is what you have been learning.
The language of flow charts
 The
major symbols are the DECISION (also known as selection) and the SEQUENCE
(or process) symbols. The START and STOP symbols are called the terminals.
The SUBPROCESS symbol is a variation on the sequence symbol. There are
also connectors drawn between the symbols and you will see these used in
the examples below. There is at least one other sequence symbol which is
used to represent input/output processes but I think it is unnecessary
so I don't use it.
The
major symbols are the DECISION (also known as selection) and the SEQUENCE
(or process) symbols. The START and STOP symbols are called the terminals.
The SUBPROCESS symbol is a variation on the sequence symbol. There are
also connectors drawn between the symbols and you will see these used in
the examples below. There is at least one other sequence symbol which is
used to represent input/output processes but I think it is unnecessary
so I don't use it.
There are some important rules concerning the symbols and these rules
apply also to other ways of stating algorithms:
- Processes have only one entry point and one exit point.
- Decisions have only one entry point, one TRUE exit point and one FALSE
exit point.
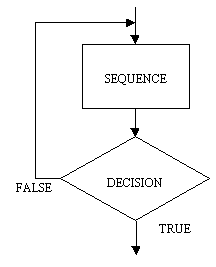 Repeat
loop. Note that the repeat loop has the process preceding the decision.
This means that a repeat loop will always execute the process part at least
once. This is an important point to remember because it may not be what
you want to do. For instance assume you are a world power in control of
an arsenal of nuclear weapons and have written a program to launch missiles
in the event of an attack. Your program contains a loop which launches
a missile each time you are struck by an enemy missile, for example:
REPEAT
LAUNCH MISSILE
UNTIL ENEMY STOPS
Is a repeat loop a good idea in this case? Probably not since, if we
assume you are not under attack and you run the program, the repeat loop
executes the process at least once and you will probably start the next
world war. A while loop would be a safer and more humane choice
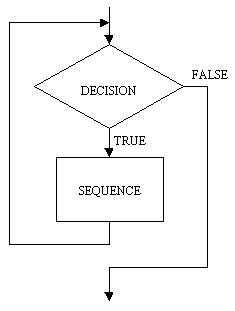 While
loop. The while loop is basically the reverse of the repeat loop, the
decision comes first, followed by the process. The while loop is usually
written so that it iterates while the condition is true, the repeat
iterates until the condition becomes true. An interesting question
is: When should a repeat loop be used rather than a while loop? and vice-versa.
The while loop should be used when it is possible that the process or processes
which are in the scope of the decision (that is, in the loop) may not
need to execute. For example assume you have a designed an air-conditioner
controller program and the program turns on the compressor while the ambient
temperature is above the desired temperature. A while loop is a good choice
here since the ambient temperature may be at the desired level before the
compressor part of the program is executed. If a repeat loop was used then
the compressor would be turned on but it wouldn't be necessary. That would
be wickedly ignorant of green sensitivities. A repeat loop would be a good
candidate for the kind of situation in which a program needs to check for
an external event at least once. For example: assume you have now written
a program for a video cassete recorder and it has a menu for doing things
like tuning TV channels, setting the date and time, programming events
and so on. When the menu is displayed it is a QUIT option along with all
the others, the VCR doesn't know which option will be chosen so it stays
in the menu mode, that is repeats it, until QUIT is selected.
|
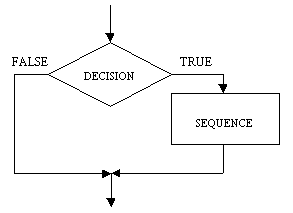 The
IF ... THEN construct is shown here and is also known as the NULL ELSE,
meaning that there is no ELSE part. I have use lines with arrow-heads (connectors)
to indicate the flow of sequence. Although this is important in flow charts
once you have gained some skill in using them and if you draw them carefully
you will find that determining the sequence is straight forward. A typical
rule is to use arrow-heads on connectors where flow direction may not be
obvious. The
IF ... THEN construct is shown here and is also known as the NULL ELSE,
meaning that there is no ELSE part. I have use lines with arrow-heads (connectors)
to indicate the flow of sequence. Although this is important in flow charts
once you have gained some skill in using them and if you draw them carefully
you will find that determining the sequence is straight forward. A typical
rule is to use arrow-heads on connectors where flow direction may not be
obvious.
|
|
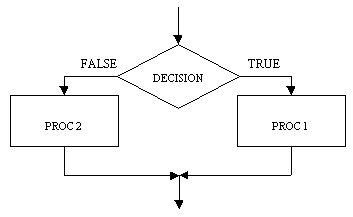 The
IF ... THEN ... ELSE ... construct has a process at each branch of the
decision symbol. The only difference here is that each value of the decision
(TRUE/FALSE) has a process associated with it. The
IF ... THEN ... ELSE ... construct has a process at each branch of the
decision symbol. The only difference here is that each value of the decision
(TRUE/FALSE) has a process associated with it.
|
Using flow charts to design programs
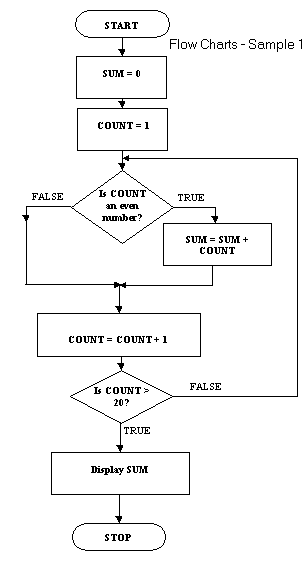 With other topics I've explained the use of technique with an example. There
is something of a precedent there. This flow chart example uses all the
symbols except the subprocess symbol.
The algorithm sums all the even numbers between 1 and 20 inclusive and
then displays the sum. It uses a repeat loop and contains a null else within
the repeat loop.
The equivalent pseudocode is:
sum = 0
count = 1
REPEAT
IF count is even THEN sum = sum + count
count = count + 1
UNTIL count > 20
DISPLAY sum
You can see quite clearly from this example what the price of flow charting
is. There is quite a bit of drawing to do in addition to writing the legend
in the symbols. The pseudocode is quite simple by comparison so why would
you use flow charts?
The major reasons are that the flow chart.
- is easier to read
- more closely follows a standard, this is not the the case with pseudocode
- probably lends itself more readily to computer-aided techniques of program design
Some rules for flow charts
Well-drawn flow charts are easy to read. What must you do to draw well-drawn
flow charts? Here are a few rules:
- Every flow chart has a START symbol and a STOP symbol
- The flow of sequence is generally from the top of the page to the bottom
of the page. This can vary with loops which need to flow back to an entry
point.
- Use arrow-heads on connectors where flow direction may not be obvious.
- There is only one flow chart per page
- A page should have a page number and a title
- A flow chart on one page should not break and jump to another page
- A flow chart should have no more than around 15 symbols (not including
START and STOP)
If you study the examples here you
should see the rules being applied.
Exercise 1
Now it's time for you to try your hand at designing a program using a flow
chart.
Draw a flow chart and trace table for the following problem:
Fred sells bunches of flowers at the local shopping centre. One
day Fred's boss, Joe, tells Fred that at any time during the day he (Joe)
will need to know:
- how many bunches of flowers have been sold
- what was the value of the most expensive bunch sold
- what was the value of the least expensive bunch sold
- what is the average value of bunches sold
There is a sample answer here
but try it yourself first.
Flow charts and subprocesses
There is one last topic to do while we are running hot on flow charts -
dealing with subprocesses. Remember that when you studied pseudocode you
learned about subprocesses and the benefits of using them.
The subprocess is useful because:
- it provides a means of simplifying programs by making common processes
available to a wide number of programs.
- it permits the modularisation of complex programs.
- it makes for more reliable programs since once it is shown that a process
works then it can be made a subprocess and need not be tested again.
In flow charts subprocesses are also useful in dealing with the flow charting
rule that a flow chart should have no more than 15 or so symbols on a page.
Here is an example of the use of subprocesses in flow charts:
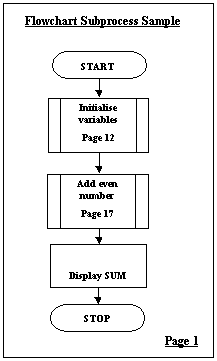 |
This is the main page of the flow chart and it contains two subprocess symbols. Each symbol contains
some legend which describes briefly what the subprocess does. Each symbol also contains a
page reference which indicates where the subprocess flow chart is.
Note that the flow chart has a title and a page number.
|
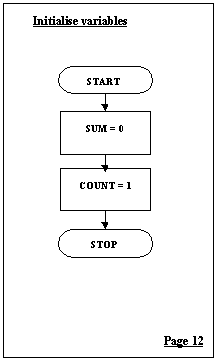 |
and here is page 12! |
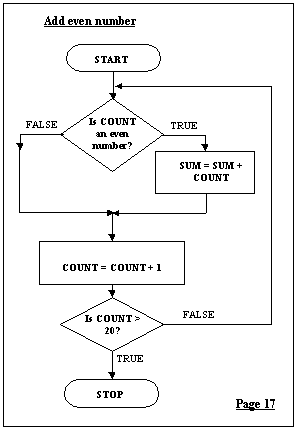
|
The Add even number subprocess appears
on its own page as indicated by the main flow chart on page 1.
|
A subprocess flow chart can contain other subprocesses, there is
no limit to how deeply these could be nested.
Exercise 2
With your answer for Exercise 1 modify the flow chart so that it has a
main flow chart and shows each of the following as subprocess flow charts:
- the initialisation of the variables
- the process or processes for calculating how many bunches of flowers
have been sold
- the process or processes for calculating what was the value of the most
expensive bunch sold
- the process or processes for calculating what was the value of the least
expensive bunch sold
- the process or processes for calculating what is the average value
of bunches sold
- the display of all the results
I have a sample answer here but
as with all the others resist the temptation to look at this first.
Using nested loops in flow charts
|
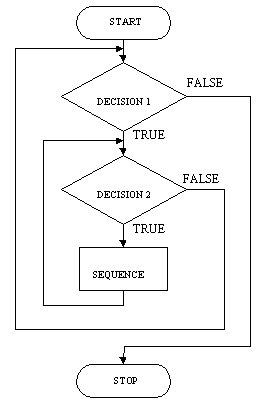
The nested while loop is shown here. This example is much simplified,
it doesn't show any initialisation of either of the loops, the outer loop
doesn't do any processing apart from the processing the inner loop, neither
loop shows any statements which will lead to the termination of the loops.
Each single step through the outer loop will lead to the complete iteration
of the innner loop. Assume that the outre loop counts through 10 steps
and the inner loop through 100 steps. The sequence in the inner loop will
be executed 10 * 100 times. Nested loops will do a lot of work.
|
|
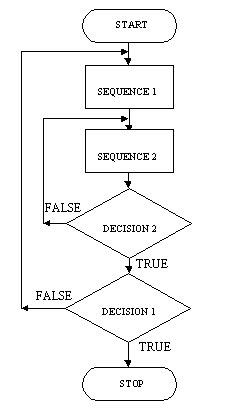
The repeat loop shown here, like the while loop example, is much simplified.
It does show two processes, sequence 1 and sequence 2, one process in the
outer loop and one process in the innner loop.
Like the while loop the nested repeat loop will see a great deal of
work done. If the outer loop does a thousand iterations and the inner loops
does a thousand iterations then sequence 2 will be executed 1000 * 1000
times.
|
Using multiway selection in flow charts
|
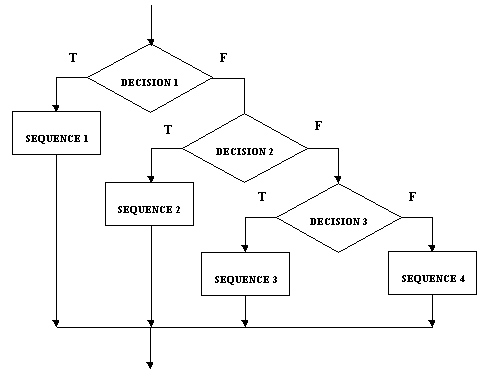
The flow chart form of multiway selection is shown here. You can see
it how it shows quite clearly the notion of decisions nested within decisions.
If decision 1 is true then sequence 1 is executed and the multiway selection
is finished. If decision 1 is false then decision 2 is tested, if this
is true then sequence 2 is done and the multiway selection is finished.
If decision 2 is false, you get the picture.
|
Exercise 3
Here is exercise 3 again from one of the pseudocode lessons. It has been
only slightly modified:
Assume you have the following data stored somewhere:
Fred,Joan,Brian,Bert,Selie,Sue,Jack,Ng,Jacques,CLASS,Chris,Cheryl,Pam,Allan,CLASS,END
and it represents students in different classes.
Design a program using flow charts which:
- reads the data and displays the names of the students in the class
- counts the number of students in each class
- counts the number of classes
There is a sample answer here
but attempt the exercise for yourself before looking at the sample.
Exercise 4
Rewrite the nested loops and the multiway selection from above as pseudocode.
There is a sample answer here
but attempt the exercise for yourself before looking at the sample.
Summary
In this lesson you studied flow charting, which is the third of the program design
techniques on our list, there is just one to go. You should have learned
- what program flow chart is
- what symbols and constructs are used in drawing flow charts
- what the guidelines are for drawing flow charts
- how to use flow charts in program design
- how to use subprocesses in flow charts
- how to use nested loops in flow charts
- how to use multiway selection in flow charts
You should also have learned a little bit more about loops and decisions
and gained some more practice at designing programs. You will probably
agree that flow charts, although easy to read, are a fairly time-intensive
way of program design.
The next lesson introduces Nassi-Schneidermann diagrams, another graphical
technique.
Return to the index
Go to the next lesson
Return to the previous lesson
This publication is copyright David Beech and Learning Systems 1997-2002
and may not be reproduced by any means without the written permission of
David Beech.
9 Wyndella Street, Tasmania, Australia
db@codelearn.com
 The
major symbols are the DECISION (also known as selection) and the SEQUENCE
(or process) symbols. The START and STOP symbols are called the terminals.
The SUBPROCESS symbol is a variation on the sequence symbol. There are
also connectors drawn between the symbols and you will see these used in
the examples below. There is at least one other sequence symbol which is
used to represent input/output processes but I think it is unnecessary
so I don't use it.
The
major symbols are the DECISION (also known as selection) and the SEQUENCE
(or process) symbols. The START and STOP symbols are called the terminals.
The SUBPROCESS symbol is a variation on the sequence symbol. There are
also connectors drawn between the symbols and you will see these used in
the examples below. There is at least one other sequence symbol which is
used to represent input/output processes but I think it is unnecessary
so I don't use it. Repeat
loop. Note that the repeat loop has the process preceding the decision.
This means that a repeat loop will always execute the process part at least
once. This is an important point to remember because it may not be what
you want to do. For instance assume you are a world power in control of
an arsenal of nuclear weapons and have written a program to launch missiles
in the event of an attack. Your program contains a loop which launches
a missile each time you are struck by an enemy missile, for example:
 While
loop. The while loop is basically the reverse of the repeat loop, the
decision comes first, followed by the process. The while loop is usually
written so that it iterates while the condition is true, the repeat
iterates until the condition becomes true. An interesting question
is: When should a repeat loop be used rather than a while loop? and vice-versa.
The while loop should be used when it is possible that the process or processes
which are in the scope of the decision (that is, in the loop) may not
need to execute. For example assume you have a designed an air-conditioner
controller program and the program turns on the compressor while the ambient
temperature is above the desired temperature. A while loop is a good choice
here since the ambient temperature may be at the desired level before the
compressor part of the program is executed. If a repeat loop was used then
the compressor would be turned on but it wouldn't be necessary. That would
be wickedly ignorant of green sensitivities. A repeat loop would be a good
candidate for the kind of situation in which a program needs to check for
an external event at least once. For example: assume you have now written
a program for a video cassete recorder and it has a menu for doing things
like tuning TV channels, setting the date and time, programming events
and so on. When the menu is displayed it is a QUIT option along with all
the others, the VCR doesn't know which option will be chosen so it stays
in the menu mode, that is repeats it, until QUIT is selected.
 The
IF ... THEN construct is shown here and is also known as the NULL ELSE,
meaning that there is no ELSE part. I have use lines with arrow-heads (connectors)
to indicate the flow of sequence. Although this is important in flow charts
once you have gained some skill in using them and if you draw them carefully
you will find that determining the sequence is straight forward. A typical
rule is to use arrow-heads on connectors where flow direction may not be
obvious.
 The
IF ... THEN ... ELSE ... construct has a process at each branch of the
decision symbol. The only difference here is that each value of the decision
(TRUE/FALSE) has a process associated with it.
 With other topics I've explained the use of technique with an example. There
is something of a precedent there. This flow chart example uses all the
symbols except the subprocess symbol.


